เข้าร่วม PU Xtrader Challenge วันนี้
ซื้อขายด้วยเงินทุนจำลองและทำกำไรจริงหลังจากที่คุณผ่านการประเมินของเรา trader assessment.
เข้าร่วม PU Xtrader Challenge วันนี้
ซื้อขายด้วยเงินทุนจำลองและทำกำไรจริงหลังจากที่คุณผ่านการประเมินของเรา trader assessment.
5 May 2023,06:02
Daily Market Analysis
While investors are still digesting the recent rate hike by both the Fed and the ECB, the equity markets continue to slide with the renewed banking turmoil. Several regional banks in the US are now teetering on the brink of collapse and are scrambling to secure vital funding in order to stay afloat. This has prompted a sharp rise in the VIX, commonly known as the “fear index”, which has surged by almost 10%, while safe-haven gold has soared to all-time highs, reflecting heightened market anxiety over the banking crisis. Attention now turns to the latest non-farm payroll figures due to be released later today (5th May), with a weaker reading potentially strengthening the belief that the Fed will pause on its monetary tightening cycle. Meanwhile, oil prices have plummeted by over 10% this week as concerns grow over the impact of the banking crisis on the global economy.
Current rate hike bets on 14th June Fed interest rate decision:
Source: CME Fedwatch Tool
0 bps (98.1%) VS -25 bps (1.9%)
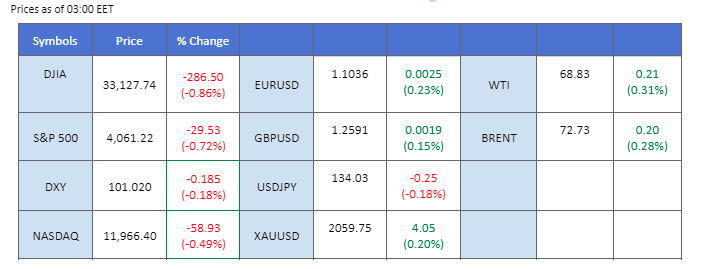

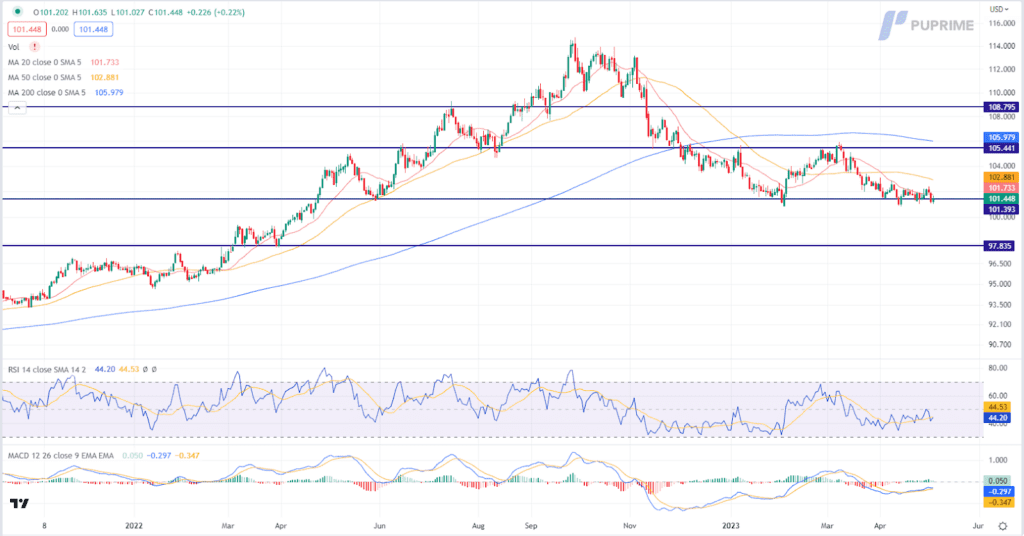
The US Dollar continues to hover near bearish territory following the Federal Reserve Chair Jerome Powell warning about the cooling economic growth and the tightening credit conditions that are putting pressure on US banks. US Treasury yields retreated as the central bank hinted at a possible pause in its rate hike trajectory. Meanwhile, Initial Jobless Claims posted a worse-than-expected figure of 242,000, failing to meet market projections of 240,000. Traders are now eagerly awaiting the release of Nonfarm Payroll and Unemployment data from the US region for further insights and potential trading opportunities.
The Dollar Index is trading lower while currently testing the support level. MACD has illustrated diminishing bullish momentum, while RSI is at 44, suggesting the index might extend its losses after breakout since the RSI stays below the midline.
Resistance level: 105.45, 108.80
Support level: 101.40, 97.85
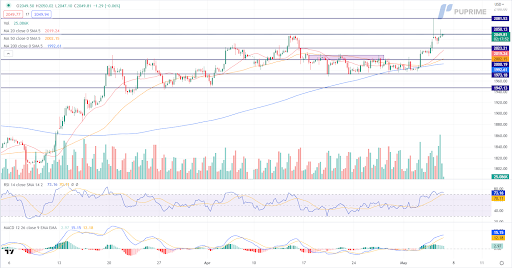
Gold prices surged to a new record high, as investors flocked to the safe-haven asset amidst a persistently risk-off sentiment. This comes on the back of heightened concerns following the Federal Reserve’s decision to increase interest rates, coupled with an ominous warning from Fed Chair Jerome Powell about the cooling economic growth and the tightening credit conditions that are putting pressure on US banks. The health of the US banking system remains a concern, casting a shadow over the country’s economic outlook. The announcement by PacWest Bancorp that it was exploring strategic options, including a potential sale of all or part of its business, led to a sharp 49% decline in the lender’s shares, triggering a trading halt.
Gold prices are trading higher while currently testing the resistance level. However, MACD has illustrated diminishing bullish momentum, while RSI is at 73, suggesting the commodity might enter overbought territory.
Resistance level: 2050.00, 2080.00
Support level: 2000.00, 1975.00
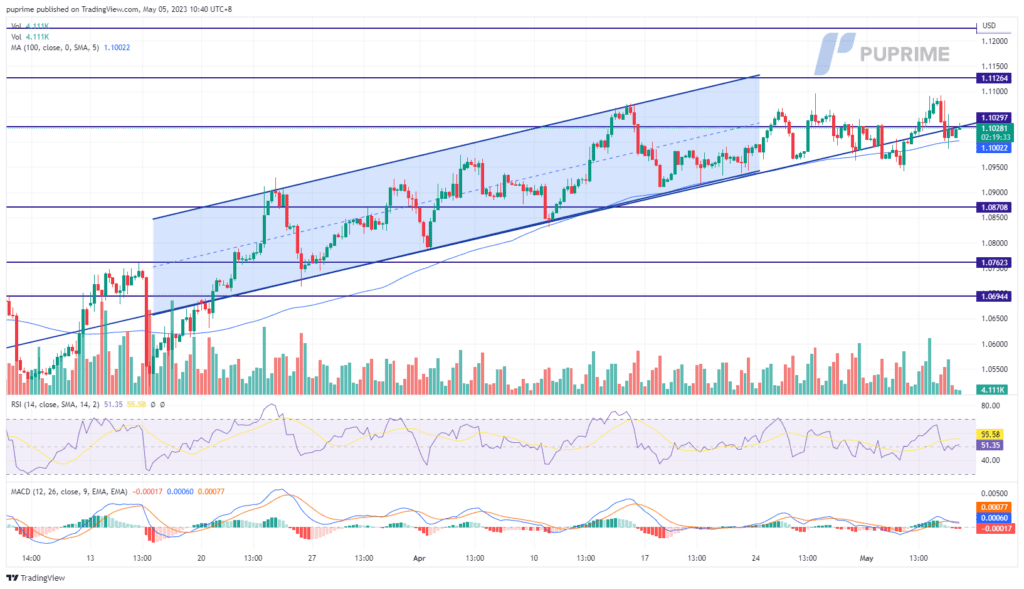
The ECB raised the interest rate by 25 bps to 3.75%, the highest since 2008 and in line with market expectations. The Euro traded lower against the dollar despite the dollar having been weak recently. However, the ECB has been hawkish before the interest rate decision announcement with speculation that the central bank may introduce a 50 bps rate hike. A smaller size rate hike has a negative impact on the Euro’s strength. On the other hand, all eyes will be on the NFP report later today (5th May), a softer reading will support the view that the Fed may pause its current monetary tightening cycle.
The Euro has been trading in an uptrend channel since March and is currently suppressed at the resistance level of 1.1100. The RSI has slid to the 50-level from above while the MACD is moving toward the zero line from above, suggesting that the bullish momentum for EUR/USD is diminishing.
Resistance level: 1.1126, 1.1225
Support level: 1.0871, 1.0762
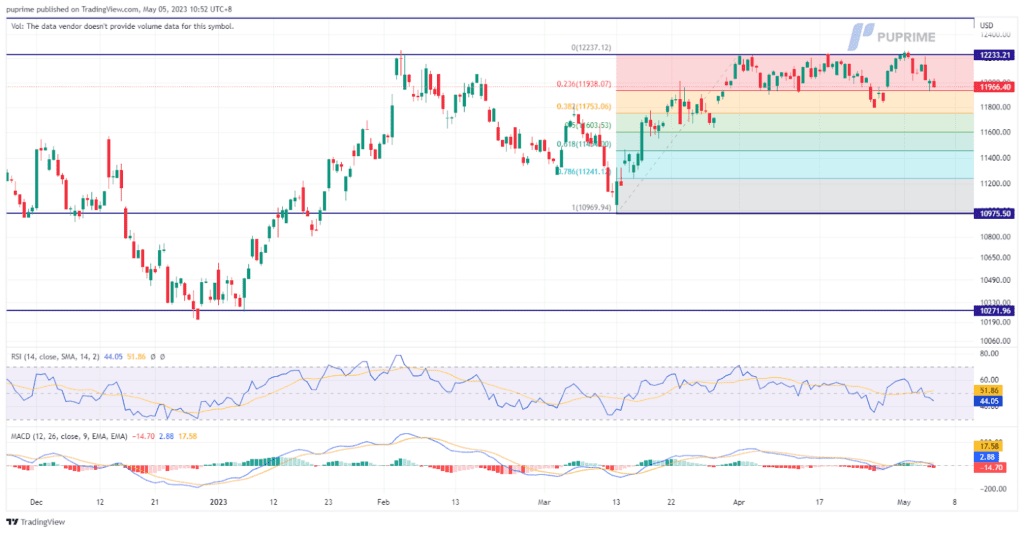
The Nasdaq fell by 0.49% to 11,966 points over concerns about a growing banking crisis and economic slowdown. U.S. interest rate futures prices suggest that traders anticipate a rate cut by the Federal Reserve by their June meeting. The jobless benefits report on Thursday showed that the number of Americans filing new claims increased, indicating a softening labour market due to higher interest rates that have cooled the economy’s demand in the economy, which may have contributed to the decline in the Nasdaq index. Additionally, the dip in Apple Inc’s stock, a major component of the Nasdaq, could have also contributed to the index’s drop. Investors may have been cautious ahead of the company’s earnings report and its buyback plans.
The trend for the stock market is moving towards its support level of 11938 points. Investors are advised to monitor closely for a possible breakout. MACD suggests a neutral-bearish momentum. Meanwhile, the RSI is currently at 44, indicating that the market is approaching oversold conditions.
Resistance level: 12237, 12536
Support level: 11938, 11753
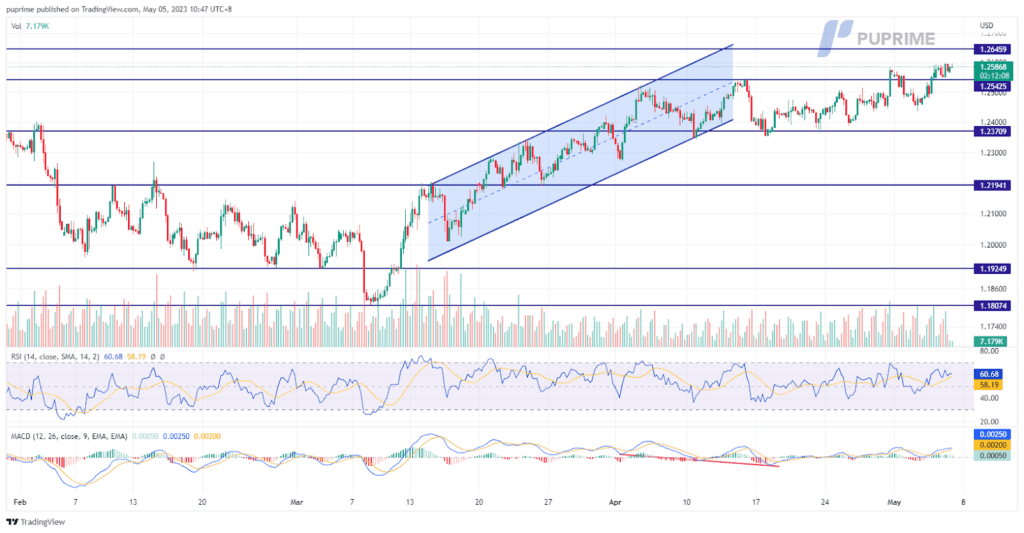
The pound held steady at $1.2586 against the U.S. dollar after hitting an 11-month high following the Federal Reserve’s decision to raise interest rates but signal a potential end to its tightening cycle. The pound capitalized on the weaker dollar after the dovish Fed decision. A survey also showed that the U.K. ‘s services sector had its fastest growth in a year in April, putting more pressure on the Bank of England to keep raising interest rates, with the markets pricing in further tightening in upcoming meetings.
The pound is currently exhibiting a strong bullish momentum, with the MACD confirming the trend and the RSI trading at 60, indicating bullish sentiment. It could further drive the pound’s recent gains, especially as the Bank of England is expected to raise interest rates in the near future.
Resistance level: 1.2650, 1.2774
Support level: 1.2542, 1.2371
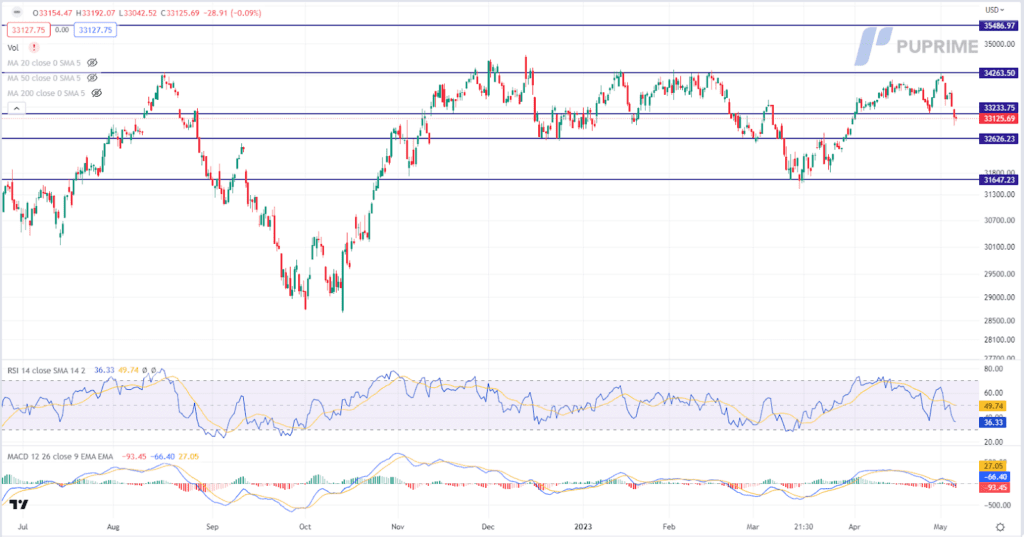
The Dow experienced a slight dip in value as PacWest Bancorp’s announcement to explore strategic options further heightened concerns surrounding the stability of US financial institutions. This news had a particularly adverse effect on regional banks, as well as major players such as JPMorgan Chase and Wells Fargo & Co, causing their shares to decline. PacWest Bancorp saw a significant drop of 51% in the wake of its announcement to explore strategic options, including a potential sale. Given the current state of uncertainty, traders are anxiously awaiting the release of the Nonfarm Payroll and Unemployment data from the US region.
The Dow is trading lower following the prior breakout below the previous support level. MACD has illustrated increasing bearish momentum, while RSI is at 36, suggesting the index might extend its losses toward support level.
Resistance level: 33235.00, 34265.00
Support level: 32625.00, 31645.00
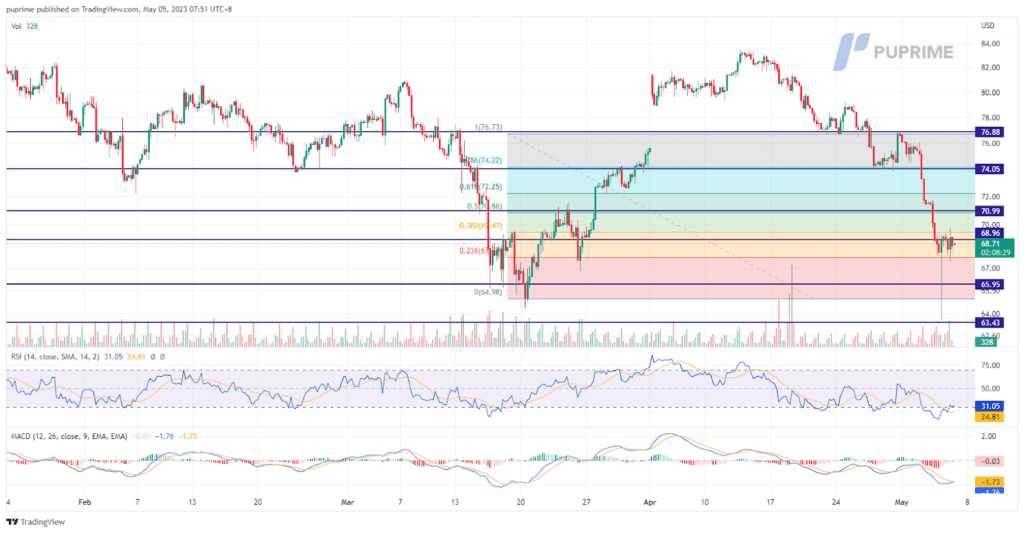
Oil prices stabilised today at $68.70 after a three-day crash caused by multiple indications of decreasing demand. The recent slump in oil futures has prompted Saudi Arabia to lower oil prices for customers in its main market of Asia, marking the first such cut in four months. Traders are concerned about the state of the global economy. A weakened U.S. economy, ongoing instability in its banks, and poor manufacturing data from China have contributed to a renewed decline in crude oil prices.
Oil prices are hovering within a narrow range after experiencing a period of decline. MACD has shown a bearish momentum by remaining below the zero line. Additionally, the RSI currently sits at 31, close to the oversold zone, which could signal a potential technical rebound in the near future. Despite this, the oil market remains volatile, and how these technical indicators will play out in the coming days and weeks remains to be seen.
Resistance level: 68.96, 70.99
Support level: 66.00, 63.43

Trade forex, indices, cryptocurrencies, and more at industry-low spreads and lightning-fast execution.

12 December 2023, 05:38 All Eyes On U.S. CPI Reading

11 December 2023, 05:23 Dollar Surges On Exceptional Jobs Data

8 December 2023, 05:50 Yen Rallies On BoJ Hawkish Comment

ไม่สามารถลงทะเบียนใหม่ได้
ขณะนี้เราไม่เปิดรับการลงทะเบียนใหม่
แม้ว่าการสมัครใหม่จะไม่สามารถทำได้ในขณะนี้ แต่ผู้ใช้ที่มีอยู่สามารถดำเนินการท้าทายและกิจกรรมการซื้อขายตามปกติได้เหมือนเดิม